Driving Injection Molding excellence with OEE

Overall Equipment Effectiveness (OEE) is a metric that people often talk about. What is it? How do you measure it? This article will give you an idea of what OEE means and how to use the data in your plant.
Many have heard of the concept of Overall Equipment Effectiveness (OEE), one of the fundamental concepts in lean manufacturing and a key performance driver for any shop floor, production unit, workshop, or individual station, and it will change the way you run your business.
OEE is a metric that can be used to measure the overall efficiency of any manufacturing process. A low OEE indicates that there are wasted resources in the system, causing loss rather than value. OEE can only be used effectively if we have a thorough understanding of how it works and what it takes to maximize it.
We understand that introducing new concepts into a manufacturing environment can be challenging, and implementing metrics to measure performance requires an investment of effort. However, embracing this concept will benefit all team members as we will regain control and see significant improvements in productivity, efficiency, and quality.
I would like to explain some important points to you before starting the implementation of the OEE system.
You are already wondering what the real meaning of OEE is, aren’t you? In our quest to better understand OEE, we have created some important tips for its successful implementation in your facility.
About OEE
“OEE is a lean manufacturing tool that measures overall equipment effectiveness — you can use it to monitor, evaluate, and improve the performance of any production process.”
OEE is more than a number. It’s a performance measure that visualizes the driving force behind why you do what you do. OEE helps you create a culture of continuous improvement by quantifying and eliminating your top sources of lost production.
OEE is important … seriously
OEE is a measure of how effective your injection molding operations are. Tracking OEE and take action upon it is the way to reach optimal and responsible utilization of resources.
To monitor our production process, we use the Overall Equipment Effectiveness (OEE) indicator. With this measurement, we can track the losses of each component of our production line and machines. This gives us a detailed picture of the effectiveness of our machines to produce products with extraordinary precision. We can also measure the true potential of our factories by determining how well our manufacturing processes perform.
Because OEE allows us to identify real problems in a more strategic way, eg. Eg staffing, the supply of materials, planning, and changes; it gives us the ability to address these issues directly.

The OEE concept helps companies stay competitive in today’s fast-paced industry.
Balancing creativity and innovation with productivity is the key to a new approach to business and manufacturing. The philosophy behind OEE will not only save you money but will also ensure that we change with the times and adopt smart practices that are sustainable in the real world.
OEE is about something called “The 6 Big Losses”
OEE is a total performance measure that helps focus improvement efforts on the most common (and critical) areas of lost productivity. These fall into three main categories: availability, quality, and performance.
OEE is an important metric that tells us how quickly, accurately, and efficiently we work. It also shows whether we can meet our delivery and quality requirements.
The six big losses serve to identify, measure, and eliminate waste for increased equipment reliability. This concept has its origin in the TPM (Total Productive Maintenance) which can be seen as a set of three objectives: continuous improvement of productivity, cost reduction and, safety of equipment and people. The 6 big losses method makes the impact of losses on production efficiency more visible.
Understanding the 6 big losses as causes of OEE inefficiencies will allow us to implement a plan to improve our operations.
Generally speaking, the 6 big losses in manufacturing are:
Impact on machine Availability:
- Planned stops
- Unplanned stops
Impact on machine Performance:
- Micro stops
- Slow cycles
Impacting the Quality delivered by the machine:
- Start-up rejections
- Production rejects
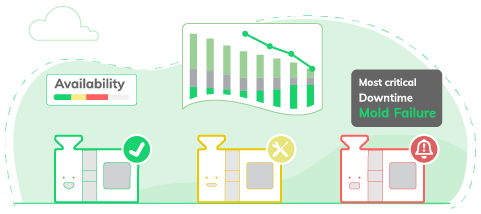
Availability
System availability is the amount of time it is running without delays affecting production. Losses in this category include planned and unplanned downtimes, such as breakdowns and preventive maintenance.
Unplanned shutdowns are considered times when the equipment is down and therefore not producing due to unplanned events. Examples include equipment breakdowns, lack of materials, downstream equipment blocking the line, or maintenance shutdowns.
Planned shutdowns form the time when equipment is scheduled for production but is not running due to planned events. Examples include changing, tool setting, cleaning, planned maintenance, quality inspection, and paid breaks.
In a manufacturing process, on-time delivery is hampered by inaccurate inventory levels, machine downtime, and other losses. The exact list of available losses varies by process and company. However, a good start is to identify the most common failure causes and see how you can group them together.
For the purpose of calculating OEE, we do not include planned activities such as major maintenance shutdowns and plant overhauls. Similarly, when lack of demand or seasonality dictates that we do not need to complete certain shifts or work on certain days, we will exclude them from the OEE calculation.
Performance
The second component of overall equipment effectiveness compares the actual operating speed of the plant or equipment to its specified operating speed. It shows what the plant accomplished during the time it was in operation.
To measure performance, we look at three types of losses. A micro stop is when the lights go out for a few seconds and need to be reset. A slow cycle is when a machine loses 30 seconds or more on each cycle.
Micro Stops: Micro Stops may be small in stature, but their impact is huge. They have a significant negative impact on our results. The main causes of micro stops are problems related to operations but that the operator can solve quickly. They take 3 minutes or less to resolve. Examples of micro stops in injection mold making include misfeeds, material jams, incorrect settings, misaligned or blocked sensors, equipment design issues, and periodic quick cleanings.
Slow cycles: Slow cycles are the time when the equipment runs slower than the ideal theoretical cycle time. Poor lubrication, a dirty environment, or worn equipment can cause slow cycling.
Quality
The third component of Overall Equipment Effectiveness (OEE) measures quality. This is simply the proportion of the actual production performance that exactly meets the customer’s specifications and is correct the first time. Quality losses are divided into two categories: production rejects and start-up rejects.
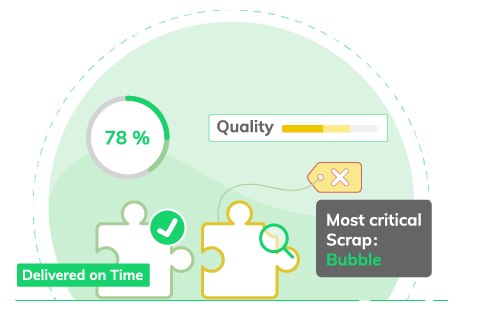
Production rejects are defects that we have produced during a stable production phase. Examples include color differences, amorphous parts, burnt sections in molded parts, and bubbles, just to name a few.
Start-up rejections are defects that occur due to some irregularity in the equipment configuration process. In this category, you can register any defect that occurs during mold changes and machine calibration. Tracking startup rejections will provide valuable insight into the equipment setup process, especially when significant waste is generated after startup.
How is OEE calculated?
OEE is the result of a combination of the three components: availability, performance, and quality. Calculating it at its general level is simple: Availability% x Performance% x Quality% = OEE%

Performing the calculations for each of the factors is a simple task when you only have a handful of different part models in production. But when you have a highly competitive manufacturing environment, in a parallel environment such as an injection molding plant, with a large number of models and part versions combined with the need to maintain a mix of small and dynamic batches with batches large, the complexity increases, making it easy to lose control. of this valuable tool that is the OEE.
The ideal of OEE would be to keep it 100%. This would ensure completely continuous, ideal speed and high-quality operations. Maintaining an OEE at 100% is extremely difficult, in fact, it is known that in Manufacturing maintaining an OEE of 85% is already an excellent level of efficiency, but it is still difficult to achieve it. Keeping OEE under control requires constant calculations and analysis, and as you know, when the combinations in the product line, molds, and machines are very large, this becomes even more complicated. Wouldn’t it be great to have a solution that helps you keep your plant’s OEE under the highest level of control without having to exert superhuman efforts to achieve it?
We invite you to try SCHEMA — our advanced production scheduling software supercharged with manufacturing execution and control tools to bring your injection molding plant to the level of excellence where you want it.