With SCHEMA you can generate in seconds the best production schedule for your plant to fulfill and deliver your orders on time.
You can follow up on the schedule with what is happening on the production floor and make the necessary changes on time. You can easily analyze where you can improve your plant and reach an efficiency level of excellence!
Click on the following buttons to learn more about how SCHEMA works.
If you have more questions, you can click on the chat bubble below the right side and a person from our team will support you with more information or visit our Help Center.
How to move within SCHEMA
The menu is on the left side, click on any icon to expand it. Each section may have different subsections.
Click outside the menu to remove the expansion.
From the upper right side of the screen, click on the profile picture to configure your company data, register new users and access permissions for your device.
Dashboard
This panel summarizes your main indicators of efficiency, performance and quality.
Monitor your data in more detail by clicking on them and they will direct you to the report in question, or you can also click on the section Performance n the menu where you can choose which report you want to see.
Here we show you a Gantt visualization of the optimal schedule generated.
Each row represents a machine, the molds are visualized with gray diagonal stripes and the parts are the batches that come after a mold, they can contain the color you selected in Work in Process. You can make modifications to the schedule:
Move the order of production batches of parts using drag and drop.
Increase and decrease production batches with double click on a batch.
Increase and reduce the installation time of a mold with double click on a mold.
Add a downtime with double click on a mold. Select the category, the reason for downtime and the time. To add your list of downtimes, go to the section Downtimes and create it.
Add notes on each machine to indicate a priority to the production floor.
Add a new production batch with double click on a mold.
Add a new mold and its production in a machine, with a click on the name of a machine.
You can check the Timetables to see more in detail what each shift should do.
You can also see the Production Orders for each batch production with the specific requirements of raw materials.
The best way to start your journey is with just a sample database.
The first step to start your journey in SCHEMA is add at least one of the following to your database: 1 Work-in-Process, 1 Finished Product, 1 Mold, and 1 Machine. These items should be related to each one another to be able to say that 1 Production Route is complete.
Once you have at least 1 complete Product Route, you can add a Customer Order and create your first production schedule.
With an ongoing schedule, you can capture real production and automatically begin to generate the Key Performance Indicators of your plant.
First, go to Raw Materials and click on the button located on the upper right side to follow my filling instructions.
Machines Production
Here you can enter the records of the production of your machines. The capture is divided by machine, click on the name of one to start. Clicking on the button will display a menu with the following options:
'Add Production':
'Add Downtime':
'Add Cut':
'Remove this Action':
The data must be captured in minutes. Do not forget to click on the button located on each machine
It is complicated to have control and knowledge of what happens in each of the machines on the production floor because many activities are being developed at the same time. SCHEMA has the solution! On many occasions, even if you have reviewed the work plan to be developed, it is normal for changes or unforeseen events to occur due to the progress that is being made during the day. In addition, you are most likely only aware of what is happening on the machine you are operating and the plant manager will only know the progress of the day until the shifts are completed and inventories/records are updated.
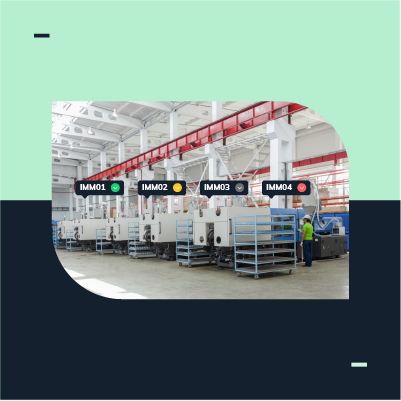
SCHEMA has developed a traffic light that allows you to know at all times what is happening on the shop floor. From each of the records you make in the production capture and without the need for further action you can get a color indicator that allows you to detect the status of each of the machines.
That is, when you enter the Production Capture section, you have a view of all the machines that make up your production floor and next to the name of the machine you will find a colored circle: Green if the machine is in active production; Red if it is in a shutdown; Yellow if it is in a non-penalizing shutdown; and Gray if it has no information captured or is disconnected in case of using an IoT device connected to the machine.
In this way, SCHEMA helps you to know the current status of your production floor and thus generate a strategy to improve performance, create or update the production schedule, address any disconnection of IoT devices and even improve communication and teamwork dynamics to all be informed in a very quick and easy way.
Here's a tip, this information is available to all SCHEMA users, just go to the Production Capture section... but it's a good idea to add a screen on your shop floor monitoring station so everyone can see it at all times.
We use cookies to improve your experience. By using this website you agree to the terms