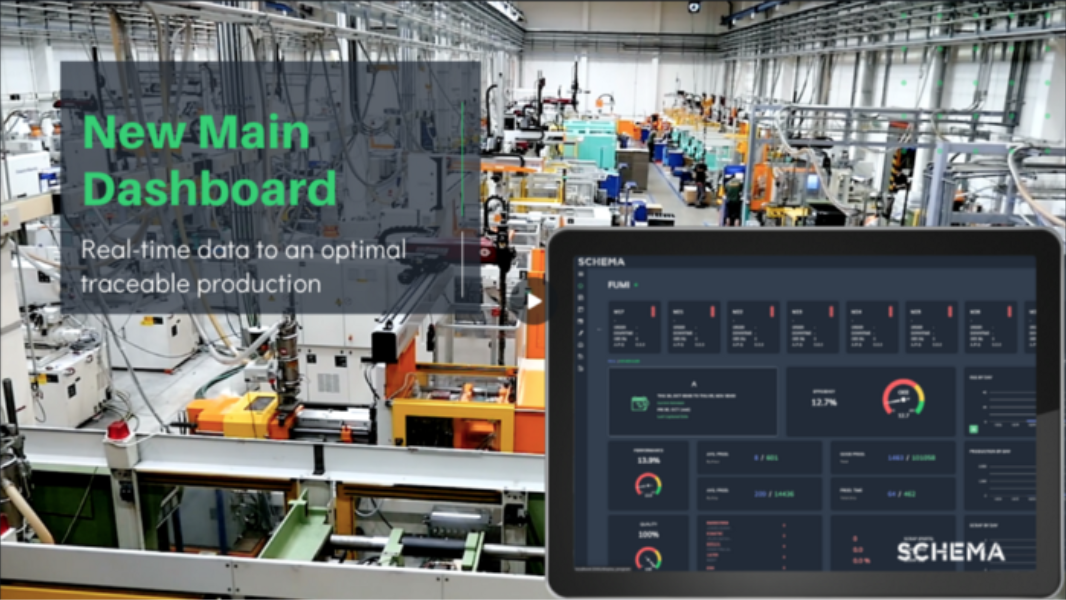
The New SCHEMA 3.0

For several months we have been working on a complete renovation of the data structure at SCHEMA. We seek to make the platform even more scalable, faster, and that allows all our Users to have more and better tools to help with the daily work in the Plant to further increase efficiency, quality, and continuity in production.
Many of the changes that we will roll out in the coming days will occur at the back-end of the platform. When making this great change in the data and process structure, we think about balancing the needs of all our Users, and also about respecting time and resource restrictions.
After analyzing it for quite some time, we realized that in Production Scheduling, we can still offer greater precision when making changes to the Program. We know that the visualization of the capacity used, available, and the sequence of orders, is a feature that we all love. We also note that sometimes it can be difficult to add scheduled downtime, such as maintenance, or to intersperse production batches of different parts. That is why we made the decision to remove the Drag & Drop functionality from the program visualization, but in exchange, we incorporated a new Smart Table in the vertical Kanban-style for each programmed action, which allows reviewing the programming by machine, and programming any type of process, with fewer clicks, and above all, in less time.

We have included new dashboards that can be displayed on one or more screens in the Plant so that all your collaborators can have a global vision of the most important production indicators in real-time. This helps increase motivation among work teams as well as to detect problems as they are occurring.
We have also made changes to the Production Scheduling algorithm to increase Product traceability. As you well know, the SCHEMA algorithm provides a double solution: It determines the optimal batch size and defines the optimal sequence of production and mold changes.
By defining the optimal lot size, the SCHEMA algorithm observes the Demand for each of the Finished Products, you can have several different Orders for the same Finished Product. The algorithm is responsible for evaluating the total demand on all these orders and generating a production order of optimal size. Although it is an extremely useful result, it had the disadvantage that the traceability of the production of the Parts produced to the Products was lost. With the update of the SCHEMA algorithm, the same optimal lot size can now be obtained, but as many production orders are generated as there are orders. In this way, each production order is now related to a specific Order-Product pair.
Since all the operation flow in SCHEMA can be managed by means of the reference to the production order, then when making the Production Capture of the machines you can also obtain the progress status of each of the Orders for each of your customers.
In addition to these changes, we also decided to completely change the Program View and Production Preview. The SCHEMA visualization, although useful, was sometimes cumbersome when loading the page and making adjustments to the Program, and the information that the Program could display was limited by the data structure. Now, the new visualization has a faster load even for Companies with more than 100 machines. The Lead data for each production order has been included directly in this view and therefore it is faster to know what is behind and what is on time. Also, at least it seems to us that the design improved incredibly.
The performance of the platform, in general, has improved significantly and we are sure that the new data structure will allow us to continue delivering new functionalities that will be ideal for optimizing the operation in your Plant.
Do you want to know more about the new features that will arrive with the back-end change? We invite you to know the new SCHEMA 3.0. Write to us at support@logykopt.com, and leave us your comments and questions.
